Below is a link to fascinating presentation by Dr. Eric Sanderson (Wildlife Conservation Society), author of Mannahatta: A Natural History of New York City. Abrams, New York (among numerous other works). In the presentation, Dr. Sanderson discusses food webs, but also introduces a new concept entitled Muir webs, which incorporate all dependencies in a system (abiotic and biotic), not just feeding relationships. He also discusses methods for describing and predicting the historical biota of NYC.
http://www.ldeo.columbia.edu/news-events/events/colloquium/on-muir-webs-and-mannahatta-ecological-networks-service-new-york-city
Wednesday, March 31, 2010
GIS lite!
Copy the entire link from http.... to GARDENS.. It's a long link..
http://www.oasisnyc.net/map.aspx?zoomto=garden:Select&categories=PARKS_OPENSPACE&mainlayers=Cache_Transit,PARKS,NJ_FOREST,GARDENS,PLAYGROUNDS,STREETGREEN,GOLFCOURSES,FIELDS,COURTS,CEMETERIES,LOTS,GARDENS&labellayers=PARKS,PLAYGROUNDS,LOTS,GARDENS
A neat interactive map. Lots of layers available for anyone who might be looking into urbanization based research. Super easy to use. Kind of a GIS lite...
Monday, March 29, 2010
Where to publish...
First--- It's never too early to try to get published and everyone gets rejected.
That said, choosing the right journal can determine when and if your work is accepted. Choosing a journal to submit your work to is a delicate balance between the journal's impact factor, turnover time, and acceptance rates. Think about the above factors and also who you want to reach with your work. Do not be afraid to contact editors if your paper has been in review for over 4 months with no word (this might vary a bit depending on how many issues the journal puts out per year). You also should carefully read the "Guidelines for Authors" and "Mission and Scope" for journals that you are interested in. It is rare (but not impossible) to get published in the top journals early in your career.
Compare the following two descriptions:
1) The "classic"- Ecology --- http://www.esapubs.org/esapubs/journals/ecology.htm
2) A new "upstart" journal- Ideas in Ecology and Evolution--- http://library.queensu.ca/ojs/index.php/IEE
***Note that an increasing trend in the top journals is short concise articles***
Resources
http://www.scu.edu/SCU/Departments/EnvironmentalStudies/whoweare/docs/Where%20to%20publish%28Black%29.htm
http://www.ecobias.org/resources_files/Aarssenetal2008.pdf
Sunday, March 28, 2010
Nature doing it's thing in Costa Rica

Three toed sloth: Mutualism - Symbiotic cyanobacteria live in the sloth's fur. The bacteria provide camouflage for the sloth. The sloth provides a home for the bacteria.

White faced capuchins: Anti-predatory behavior - As I approached, one mounted the other in order to look larger.

Layers of the rainforest: Competition for sunlight - Saplings in the understory shoot up when larger trees fall. Vines and lianas wrap around tall trees. Epiphytes grow on the nooks of trees.


Bromeliad ecosystems: Mutualism - The leaves form a vase like shape and fill with water. Critters (like the one in the top photo), live in the bromeliad and release nutrients.
Leaf-Cutter Ants
We found leaf-cutter ants in every location that we visited. They are so ubiquitous in Costa Rica that one of our hotel owners had a metal sculpture of them on her welcome sign.

Here's my video of the ants at work.

Here's my video of the ants at work.
Anti-Predator Adaptations in Costa Rica
So, Oriana and I wanted to share some of the amazing things that we found in Costa Rica that applies to the topics we have covered in class. We traveled to a number of different locations and experienced a lot of different microclimates. Although we were there during the dry season we went to higher altitude cloud forests (with tons of rain), to very arid farmland and forests to a super humid nature reserve right along the Pacific ocean.
Here are a few of the anti-predator adaptations that we found (if anyone wants to go ahead and identify these organisms, feel free).
In most locations we saw plants with structure defenses in the form of thorns and spines.


We also found a number of animals with cryptic coloration. The coloration used by these animals varied based on the location that we found them.
This green lizard was in a cloud forests that had a lot of green and brown vegetation on the ground.

While this brown lizard was found in the dry and hot Pacific coast nature reserve.
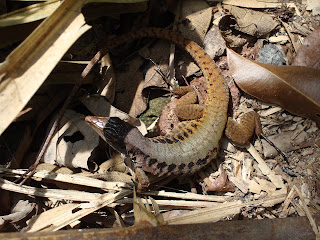 This lizard was found in the same park as the brown one (very dry and sandy location).

We also found many blue morpho butterflies that have warning eyespots when their wings are closed.

Location, location, location!!! Huge termite mound high in a tree, possibly to avoid predation?

In response to plant defenses, this leaf miner insect left behind a pretty image.

Here are a few of the anti-predator adaptations that we found (if anyone wants to go ahead and identify these organisms, feel free).
In most locations we saw plants with structure defenses in the form of thorns and spines.


We also found a number of animals with cryptic coloration. The coloration used by these animals varied based on the location that we found them.
This green lizard was in a cloud forests that had a lot of green and brown vegetation on the ground.

While this brown lizard was found in the dry and hot Pacific coast nature reserve.
 This lizard was found in the same park as the brown one (very dry and sandy location).
We also found many blue morpho butterflies that have warning eyespots when their wings are closed.

Location, location, location!!! Huge termite mound high in a tree, possibly to avoid predation?

In response to plant defenses, this leaf miner insect left behind a pretty image.

Thursday, March 18, 2010
On Rarity and Richness
Hi All! Happy spring break and happy St. Patty's Day!
Does anyone have the ability to access the full article below? Can we access it through Fordham? It appears pretty relevant to class and reflects a few conversations that have gone on. I've had no luck tracking down who the two elusive researchers from UCAL Davis are, so I can't find the original paper (if there is one?)
Enjoy the rest of break!
http://www.sciencemag.org/cgi/content/short/327/5971/1318
An interview with the author starts on pg 6 - http://www.sciencemag.org/cgi/data/327/5971/1395-b/DC1/1
Wednesday, March 10, 2010
Studying for the Midterm
How’s the studying going? Hopefully well! Earlier today there was a productive study session in LH 370. Here’s what we learned:
 Be cautious, however, if your study partner tries to eat one of the text books.
 It’s always a good idea to consult the text books!
Be cautious, however, if your study partner tries to eat one of the text books. Those zero growth isoclines get a bit trippy if you stare at them long enough… carrying capacity over alpha is greater than what?
 After too long, we all find ourselves passing out on the desk using Peter Morin’s Community Ecology text as a pillow, don’t we? The solution – espresso shots and chocolate covered coffee beans!
Happy Studying!
Tuesday, March 9, 2010
Meta-post
Thanks for all of your wonderful posts and comments! I hope this is useful and fun and not too overwhelming!
Regarding Thursday night exam- I was not able to get a computer lab so we will be meeting in the regular room and writing using pencils and pens!
Some general comments regarding issues that we have touched on but been too time-strapped to explore further:
What is equilibrium? One definition is that it is "the point at which forces cancel each other". To a community ecologist, the "forces" might be competition, predation, mutualisms etc. (biotic factors), which is, of course, a gross oversimplification of nature--- Comm. ecologists may integrate disturbances, as we saw with the Moretti paper and its investigation of fire. An example of a "theoretical equilibrium" is the abundances of two competing species that results in crossing of their zero-growth isoclines-- all other things (prey populations, parasatism, climate, floods, fires, etc.) being equal (never the case), the "community" would be at equilibrium. Also, the community might be locally stable if a small increase in either results in a move back towards the center. Generally however, more studies are debunking the idea of the "balance of nature" or any sort of stable system. Fluctuations and chaotic change in population numbers seems to be more the rule than the exception. I think this topic will continue to be discussed as we move forward in the class.
Species richness and other measures of diversity- Which is the best to use? A benefit of observed species richness is that it is easy to understand and convey. Diversity indices provide numbers that are only interpretable relative to each other. Estimators, while supposedly being more robust, take you one or more steps from your empirically observed data. As you keep fiddling with different estimators, indices, functional descriptions, etc. you can run into the problem of too many analyses (inflating type I error), and ultimate confusion! Best idea is to really read up on the literature beforehand and develop a compelling a priori dependent variable for your a priori hypotheses. Email scientists that have published these papers and ask them for ideas for good measures or diversity to use.
Lemaitre et al 2009- Did they just die of the cold? The authors state that the primary source of mortality was hypothermia and they also state that "the effect of temperature was additive to other variables influencing survival and did not interact with the presence of bot fly (Appendix 1, ESM; Table 1)." I did not see the interaction data in Table 1 and could not access the appendix to evaluate this claim (without seeing mean temp for bot fly + vs. -). They give this data for confinement time in the discussion.
Invasive species? Are they all that bad? Short answer: if they compete with you, no. If they eat you, yes. From Sax and Gaines 2008 (not a required reading):
"Among the 204 vertebrate species with listed causes of extinction, some form of predation (including human hunting, carnivory, and infectious disease) is cited as the sole factor responsible for species extinctions in 69 (33.8%) of extinctions, predation together with other
contributing factors is cited for 85 (41.7%) of extinctions, and competition together with other factors is listed for 18 (8.8%) of extinctions. In no case is competition listed as the sole cause of species extinction."
More evidence for the importance of predation relative to competition?
P-values irrelevant? I think so but keep following the increasing literature on this debate. All the techniques you learn in stats (regression, anova, ancova, etc) can be assessed in an information theory framework so are completely relevant to your development as ecologists. The "Pitfalls" article mentions that you should either use p-values or information theory but not both-- this seems a little dogmatic. Some reviewers will be more familiar with p-values and others with AIC--- if it you have space you may want to provide both. Just keep your inferences locked to one paradigm.
Thursday, March 4, 2010
Leamaitre et al. Bot fly parasitism of the red-backed vole.
While most investigations that identify factors that control population dynamics tend to focus on predation and competition, there is little empirical evidence of the role that parasites play on host populations. This study aims to assess the role of parasitism of red-backed vole by bot flies in boreal forests in Quebec, Canada.
The red-backed vole was chosen for this study as it is the most abundant small mammal and primary host of bot flies, in eastern Canada. Density-dependent impacts of bot fly parasitism on host survival and reproduction would ultimately be needed if this parasitism regulated vole populations.
In order to determine the potential impact that bot flies have on regulating populations of red-backed voles, this study:
- Assessed the impact of the parasites on:
- Probability of vole survival under stressful conditions, and whether this was density dependent.
- Reproductive activity in females
- Indentified main factors driving the relationship between:
- individual risk of infection and
- abundance of bot flies in red-backed voles, host abundance, two host life history traits (sex and body conditions) and combination of three habitats variables
- Impact of bot fly prevalence on growth rate of red-backed vole population between mid-July and mid-August
The probability of vole survival in live traps decreased with bot fly infection. The authors state that this indicates that infection by bot flies on red-backed voles is a recent coevolution since strong host-parasite coevolution should not reduce host survival (as this would impact parasite survival). However some authors argue that the reduced host survival is not so much due to coevolution hypothesis as it is an artifact of mark-recapture studies. Resident voles would be more highly infested (due to bot egg placement near burrow openings) and more resident voles would be recaptured than transient voles which would inflate survival estimates of highly infected resident voles.
Probability of infection and abundance of bot flies in red-backed voles, were both negatively correlated with vole abundance. The authors concluded three possible reasons for this.
1. A one year time lag between population cycles of host and parasite since the bot fly requires two years from egg deposition to adult emergence.
2. When vole populations are at capacity, a larger proportion is transient and these transient voles have lower probability of infection.
3. Dilution effect of all hosts could occur when vole population is high.
Sex and body condition of the host and habitat variability were not significant predictors of infection probability and abundance of bot flies.
Bot fly infection prevalence was linked to a decrease in short term growth rate of vole pop over summer. This study indicates that bot flies can impact host population growth, during peak reproductive season of the host.
Bot flies have the potential to reduce survival of red-backed voles, an effect that may apply to large portions of populations. This study supports the idea that parasites may play a role in regulating population dynamics of hosts, although bot flies may be more of a limiting factor than a regulating one.
Another key point from discussion in class: since most mortality in live traps was due to hypothermia, the conclusion from this would be; don’t freeze the voles in your experiment, it might screw with your data.
Hey All,
Here is the link to the NPR radiolab episode we were talking about in class. Its pretty entertaining! Enjoy!
http://www.wnyc.org/flashplayer/player.html#/play/%2Fstream%2Fxspf%2F133384
ps. the bit about the hook worms curing allergies starts at approximately 30 min, the explanation of crazy cat ladies follows shortly after
Johnson and Omland: Why everything you know about P-values is stupid
Johnson and Omland argue for a new model of evaluating statistical tests instead of the traditional P-value tests against the null hypothesis. While we are used to tests with a null hypothesis, it is typically biologically irrelevant and its rejection is only indirect support for another alternative hypothesis. Furthermore, rejection happens at an arbitrary threshold and can be ineffective at evaluating incredibly complex and dynamic systems that biologists routinely study in nature.

And out of the wasteland of useless null hypotheses, “model selection” emerges as a saving light! Since it is able to evaluate and select a best-fit model out of a number of candidate models the researcher has proposed, it can evaluate complex situations and multiple influences. After using a simple X2 test or a parametric bootstrap procedure to fit the global model to the data, individual models can be evaluated by Least Squares to determine their effectiveness, and the Schwarz and Akaike Information Criterion can synthesize several models simultaneously into a new “best set” of available models.
Johnson and Omland highlight model selection’s successes in biological fields. In ecology, model selection is extremely useful in modeling population cycles, and abundance and survival probabilities. By modeling different survival and encounter probabilities, researchers can separate the probability of marked animal death against the probability of the marked animal surviving but not being recaptured. In addition, model selection is extremely useful for phylogenetic trees, where the order of each mutation is treated as a separate model and evaluated against one another for best-fit. Lastly, they mention that it can also be used for identifying selective pressures and adaptation in the wild.
In their second to last section, they highlight fields that should have converted to the wonders of model selection, but are stuck in the heathen ways of null hypothesis tests. In particular, they cite statistical phylogeography as being able to use current genetic distributions to recreate possible historical populations. In ecosystem science, model selection would be able to evaluate complex trophic systems and multiple food-web models.
Johnson and Omland do acknowledge a few pitfalls about using model selection, but give very little time addressing these issues (apparently leaving it to Anderson and Burnham). First, they note that the conclusions can only be as the multiple models the researcher develops before testing the data. However, I see the eagerness to jump onto the model-selection bandwagon can start from poor initial hypotheses and relying solely on post-hoc conclusions. Secondly, they state that the predictions must actually be biologically plausible and not “merely” statistical significant. If these are not plausible but are “statistically significant” this should indicate either a flaw with this modeling or an unknown factor that is biologically plausible. And lastly, they state that it might not be useful in all situations and null hypothesis testing should be preferred.
…wait what? I thought you were telling us that null-hypothesis tests were terrible and model selection infinitely better? Perhaps they have a little realistic sense about this model after all.
These models do seem like they could be extremely useful, but I would exercise extreme caution about making too many post-hoc conclusions based on the data. And while these models are evaluated as best-fit, there is no objective decision for when the best is good ENOUGH. All models could be relatively terrible at evaluating the natural situation. I would see Anderson and Burnham’s paper for more discussion about the dangers of these tests.
Moretti et. al. 2009: Taxonomical vs. functional responses of bee communities to fire in two contrasting climatic regions
Moretti (et al 2009) examined bee communities in response to fire as a model of animal function trait response to environmental change. The study took place in two different regions; a temperate climate on a mountainside in Switzerland, and a Mediterranean climate in Israel. The climate in Switzerland was wet/warm in the summer, and dry/cool in the winter, while Israel was hot /dry in the summer, and cool/wet in the winter. Both areas are prone to fire but they occur more frequently, of higher intensity/extent, and during the summer in the Mediterranean climate, while in the temperate climate they are of low-medium intensity and quick spreading, furthermore they mainly occur in the winter (coinciding with vegetation dormancy).
Bees were collected at 21 sites in each of the study areas. These sites were located in a range of habitats in different succession stages following fire (e.g. from recently experienced fire, to no fires for 20-30 years, to unburnt areas). Bees were identified and functional traits were described. Functional traits, listed in Table 2, are such things as nesting specialization (in the mud, in wood, snail shells etc.), dispersion (measured as ITD, inter-tegula distance, i.e., distance between wings), or other characteristics of an organism which has demonstrable links to the organism’s functions. Functional traits were calculated into mT, an average for a given trait weighted by species abundance, and a measure of functional diversity (FD). *this may be a rough definition, but I understand functional diversity as the diversity or range of things that an organism, or an organisms traits, do in a community*.
The hypotheses of this study were: “(i) fire affects both species and functional composition of bees at both taxonomic and functional levels, that is, through extinctions, immigrations, or dominance redistribution within the community; (ii) the response of bee communities to fire is smaller in the Mediterranean region because of the longer history of fire in arid conditions”.
Following fire disturbance, a greater number of species were present than pre-fire conditions in both climates. However, this diversity of species decreased quickly following fire, likely because habitats immediately following fire support the highest floral diversity compared to later successional stages.
Functional traits selected by fire were similar in both countries, but some traits were identified which were affected differently between the two regions (Table 4). This differentiation in trait responses highlights the effects of the regional climates and fire regime on the functional components within the regional species pool. This can be further explained by looking at Figure 2, which displays the variance of mean traits and functional diversity in each climate. Overall, mean traits and functional diversity change more dramatically in Switzerland than in Israel (Figure 1). Changes in functional diversity in Israel due to fire were not significant, while they were Switzerland (albeit, only be 21.9%).
What this tells us, is that the responses of bee traits to fires are not exclusively a result of the fire regime in the area, rather, the climate of the region as a whole, including landscape structure. The climate and landscape influence the diversity of traits present. In Israel, the landscape is highly heterogeneous as a result of land use, vegetation type, and fire, resulting in higher heterogeneity in species and trait assemblage. Switzerland, on the other hand, dominated by quickly establishing chestnut trees, is less heterogeneous, and therefore, there is less heterogeneity in bee species and trait assemblage. So, despite results showing a significant shift in species composition with fire in both regions, the functional composition of the bees present in the Mediterranean remained stable, likely as a result of the regions characteristics and functions and higher diversity of traits in the system.
Below is a link to a presentation by Moretti. It discusses some of his other work, but the 2009 paper is presented beginning at slide 51. I recommend looking through the entire presentation as it’s pretty interesting/helpful. Also, note page 58, it has a figure of the species response to fire in both the Mediterranean and temperate climates (I think this would have been good to show in the paper, but I guess if he had to cut a figure, this would be the best one).
I’ll update this if any issues/questions arise in class. See ya in a few hours!
http://www.eurac.edu/NR/rdonlyres/836134A5-3468-4888-979C-C32A14370A06/0/Moretti_Marco.pdf
Anderson and Burnham: Avoiding Pitfalls When Using Information-Theoretic Models
Anderson and Burnahm discuss the growing shift away from simple null-hypothesis testing to the more complex and arguably more meaningful models based on information-theory, specifically in wildlife biology. This shift has been prompted by the limitations inherent in null hypothesis testing. However, as the use of information-theory rises, so does the misuse of its methodology. Luckily for us, Anderson and Burnham are here to point out our mistakes and move us in the right direction.
The common mistakes fall into 3 categories: basic science, methodology, and just plain wrong.
Basic Science Mistakes:
1) Poor Science Question - Null Hypotheses are silly! They don't ask relevant interesting questions and since when is science black and white? Having multiple possible models will most likely yield a more descriptive answer. However, models must be chosen carefully because the more specific the models become, the more likely it is that they won't capture reality.
2) Too Many Models - Some scientists are becoming too reliant on computer statistical analysis and don't put enough thought into their data analysis. They may let the computer analyze all possible models rather than reducing the number after some consideration of the science regarding the issue.
3) The True Model is Not in the Set - A model cannot possibly fully represent the issue being investigated. However, information-theory can try to estimate how close a particular model is at representing the truth.
4) Information-theoretic Methods Are Not a "Test" - Null Hypothesis tests (and their resulting p-values) cannot be mixed with information-theory results. These are two different approaches of answering a question that lead to different results with different interpretations.
Methodology Mistakes:
1) Poor Modeling of Hypotheses - Applying mathematical models to alternative hypotheses is difficult and often leads to mistakes or oversimplifications. Linear models are often chosen due to their simplicity but are often not realistic - asymptotes, thresholds, etc should be considered.
2) Failure to Consider Various Aspects of Model Selection Uncertainty - Scandalous! The statistical uncertainty of choosing a best fit model is often not included in the model's precision.
3) Failure to Consider Overdispersion in Count Data - Overdispersion occurs when data independence is assumed but may actually be dependent. This results in underestimating sampling variance.
4) Post hoc Explanation of Data Not Admitted - Data analysis should never be influenced by the outcome of the results.
5) Statistical Significance versus Quantitative Evidence - P-values must be euthanized! Information-theory has no predetermined alpha levels that magically make results significant or not. Instead, significance is based on the strength of the evidence and biology that is being addressed.
6) Goodness of Fit Should Be Assessed Using the Global Model - GOF should not be assessed for each model, but on the most highly parameterized model
7) Failure to Provide All the Needed Information - Many papers using information-theory leave out values for important information in their results, which can hinder the interpretation of their models.
Outright Mistakes:
1) The Incorrect Number of Estimable Parameters (K) - There are many variables that influence the value of K, which are not always included.
2) Use of AIC Instead of AICc - AICc should be used for smaller sample sizes.
3) Information Criteria Are Not Comparable Across Different Data Sets or Different Response Variables - pretty self-explanatory. Data sets must be analyzed separately and response variables must be kept consistent.
4) Failure of Numerical Methods to Converge - Computer software can fail to converge on the maximum of the log-likelihood. When this happens seek professional help.
So, is null hypothesis testing dead and should p-values be "euthanized"? If it's so terrible and outdated why is it still so common and taught as a ritual to students?
Gonzales and Arcese: Herbivory more limiting than competition on early and established native plants in an invaded meadow
Here is it, the big question! Which is more important: Competition or Predation? According to Gonzales and Arcese...in this case...predation wins! (kinda)
Here's a short review of what happened in this study. This study was conducted in a fragmented oak meadows in Canada. In these meadows, there was a native grass that is declining in abundance compared to an invasive grass that is increasing. On its face, this appears to be an open-and-shut case of competitive exclusion of the native by the invasive. However, the researchers also mention that this habitat is fragmented due to human activities, which along with general disturbance often have the effect of decreasing the local carnivores that would keep the herbivores in check. This has lead to an explosion of the deer population in these areas, which could have increased the effect of herbivory (predation on plants). And so with all this in mind, Gonzales and Arcese propose 3 hypotheses: 1) The invasives are out-competing the natives 2) Deer are consuming too many of the natives compared to the invasives or 3) some combination of both. They then conclude by saying they think that herbivory has the greatest effect
(completely unrelated to ComEco, this sort of reminded me what was asked in Stats last night about just starting with multiple hypotheses and then following the one that's the most right....does anyone else see that?)
In the experimental design, there were several. First with the grasses, they had a 2x2 factorial where they have transplanted native grasses and native grass seed addition that varied by + or - herbivory and + or - competition (either by clearing or severing the roots of neighbors). And this design was repeated for the flowering plant seed addition experiment. In a 3rd experiment, they did a bulb addition experiment of lilies, but how they set this up was a little hard for me to follow. And just to quickly summarize their results; all of the graphs for all of the experiments show that when you remove herbivory, the biomass for all examined species increased.
So what does it all mean? Well, after re-examining their hypothesis, they decide that the dominant effect on the decrease of the native plants is due to herbivory. When they first approached the problem, the usual suspect to blame in these cases seems to be competitive exclusion. However, after this experiment, this seems to be a case of "apparent competition" where because the natives where being preferentially fed on by the deer, we could only see that the natives were declining and the invasives were increasing.
And discovering that herbivory (plant predation) was having a larger effect on the natives than competition seems to be a complete 180 degrees from Errington's Hypothesis. Remember that Errington thought that predation would only have a small effect on organism abundance. Yes, the full hypothesis is meant for larger, motile organisms, but if you squint and turn your head to the side, you can see how part of it could be shown to apply (and then fail) for this situation. For example, Errington says that the survivors would have increased fecundity, presumable because their kin are not there taking up resources. However, this leads into the second part of Gonzales and Arcese's finding that herbivory isn't the whole story. There is also a competition effect! Sure the native grasses should be able to re-fill the spaces where their kin had been consumed from, but the invasive is just better at filling those empty spots.
So, in conclusion, Gonzales and Arcese show that herbivory can have dramatic effects on the welfare of native plant species in disturbed ecosystems that can lead to giving the invasive a competitive advantage. And another theme that we keep seeming to come back to; deer are evil and the cause of a lot of ecological damage. And if you needed more proof that deer are evil, I submit the following picture as my evidence. See you in class tonight!
 Figure 1: Aren't they cute with that maniacal twinkle in their eyes?You have to click on the picture to see the whole thing. The blog has cropped it so you can't see all of it. I did a google image search for "evil deer" and this was the best shot. Seems like we keep coming back to how evil deer are with their tendency to mess up plant communities when their numbers get too high.
Wednesday, March 3, 2010
Friendly Invaders
This short article by Carl Zimmer challenges the common view of invasive species as a threat to biodiversity. The prevailing view is that invasive species outcompete endemic species and drive them to extinction. Zimmer reports the findings of two scientists, Dov Sax, an ecologist from Brown University, and Steven D. Gaines, a biologist from U.C. Santa Barbara. The two published an article in PNAS which documented extinctions of native plant species in New Zealand due to invasive species. Here are the numbers: 2,065 native plants, 22,000 non-native plants, 2,069 of which have naturalized, leading to 3 total extinctions. Sax and Gaines argue that invasive species are not all bad. In fact many times the extinctions they are predicted to cause never actually happen. They say that the increased competition creates a selective pressure that spurs the evolution of greater diversity. Often invasives will hybridize with native plants to form new and wonderful species like the common cordgrass (See awesome picture below).

The two scientists say that often there is more than enough room for invaders and the native species. There is also mention of invasions throughout biological history that have led to increases in biodiversity rather than extinction. They give an example of pacific mussels invading north atlantic mussels. Rather than causing the atlantic mussels to go extinct the two species hybridized forming a new species, thus increasing biodiversity.
Critics of Sax and Gaines, such as Anthony Ricciardi from McGill argue that invasive species are a greater threat than ever due to their rapid spread by humans and the pressure already placed on native species due to climate change. He says that the extinctions could be eminent.
So maybe invasive species aren't so bad....think again. I say invasive species are hurting America. We need to put up a wall to keep out the invasives so that they stop taking niches away from hard working native species. I know what you're thinking, they do the jobs no one else wants, if we didn't have honey bees we'd be pollinating all those flowers ourselves, and no one wants to do that. But that's the kind of laziness that led to this:

THE ASIAN CARP!!!!!!
These fatties can grow up to 3 feet long and weigh 100 pounds. They eat everything in sight (consumptive competition) causing native fish to starve. They are threatening to destroy the $4.5 billion great lakes fishing industry (http://www.glu.org/asiancarp). Not only are they threatening to kill off fish, they are threatening to kill us. Asian carp are easily startled and jump out of the water. One fisherman was witness to the dangers of the fish, "One of our guys got hit in the (groin). It's insane," said Bob Bennington, of Streater, Ill."
It certainly doesn't end with the Asian Carp. There are a number of economically disastrous invasive species. They are costing the US billions of dollars in damage. (http://www.mnn.com/lifestyle/pets-animals/stories/invasive-exotic-animals-costing-us-billions-of-dollars). The USDA keeps a comprehensive list of all invasives, check it out at: http://www.invasivespeciesinfo.gov/
Gotelli and Colwell, Quantifying biodiversity: procedures and pitfalls in the measurement and comparison of species richness
Species richness is a common measurement in describing diversity and community structure. It is an important tool in conservation efforts, which frequently aim to maximize an area’s richness and thereby, increase its biodiversity. Despite its simplicity as a concept, species richness, or the number of species present, is often a very difficult measurement to accurately obtain and is even harder to properly apply to an ecological study. Gotelli and Colwell describe some more methods for obtaining species richness data as well as common pitfalls in their utilization.
Presented in Figure 1, are four alternate taxon sampling curves based on two dichotomies. The first being the unit of measurement: individual- or sample-based; and the second being the method of collection: accumulation or rarefication curves. Individual-based simply determines the number of species looking at randomly decided individuals in each plot while sample-based sets random samples and determines the number of species in each and pools the collected data. There exists also a “hybrid” method (not shown in Fig. 1), “m-species list”, in which the first m number of species encountered in a sampling area are listed and is repeated for multiple samples, plotting the number of new species against the sample number. Accumulation curves function similarly in that with each new sampling effort, the new species found are plotted until, ideally, no new species are being recorded and the curve reaches an asymptote. Alternatively, rarefcation curves repeatedly sample the collection of a certain number of samples/individuals, recording the number of species observed with consecutively increasing (or decreasing) sample numbers. When plotted, this too will ideally reach an asymptote, as a some number of increasing samples should ultimately contain all species present.
These curves, which have the potential to accurately describe the species richness of the area in question, need to be applied with caution. Figure 2 shows that a rarefication curve, when rescaled from samples to individuals, gives conflicting data. It is important to compare richness based on individuals rather than samples given the possibility of datasets to differ in their mean number of individuals per sample. There are pitfalls associated with the “m-species list” method as well when comparing species rich to species poor sites (Figure 3). This method requires a greater sampling effort in the species- poor site in order to reach the required number of m species. And should ideally level out sooner than the species rich site. However, in a case where sampling stops before an asymptote is reached, both sites will appear to have similar richness.
Category-subcategory ratios, such as species to individual ratios, are often used to make richness comparisons. Figure 4 shows two examples of pitfalls in using this value. This ratio is dependent on species density, and as seen in 4(a), samples with equal species richness may still show different ratios. Also, the ratio assumes that richness increases linearly with abundance so that it is possible to obtain equal ratios when the richness is in fact different (4(b)). Figure 5 and 6 explain the pitfalls in using a species/genus ratio. This ratio will be greater for a larger sample than for a smaller sample. Traditionally, a low ratio is attributed to strong intergenic competition, but more recent evidence suggests that this is not always the case. Figure 7 compares two rarefication curves (one individual and one sample based), which are used to determine species richness or density. In the individual based curve (a), both treatments must be “rarefied” to the same number of individuals (white dot) to compare the richness as the complete samples (black dots) give the species density, while in the sample based curve (b), the complete samples give the richness, so the treatments must be rarified to the same number of samples to compare the species density.
One final issue of importance is the use of asymptotic estimators in instances where exhaustive sampling is impractical. Extrapolating from rarefication curves does not provide a reliable estimate, as it is essentially a tool for interpolation. Nonparemetric estimators are a better option. One example is based on the number of rare species- a larger amount indicates a greater likelihood of species not represented by the dataset. There are some asymptotic estimators, which have proven accurate when used on small datasets for which the richness is known. In applying these estimators to larger datasets, which have not begun to level off, however, an asymptote is not always reached. In these cases the estimator serves as a lower bound estimate of richness.
Hawkins et al 1997
The authors used life tables of insects to quantify levels of enemy induced mortality. Three factors were analyzed for differences in assocation: enemy type, (predator, parasitoid, or pathogen), the developmental stage of the insect (egg, early larva, mid-larva, late larva, and pupa) when killed, and ecological characteristics of the herbivores (feeding biology, invasion status, and the cultivation status and latitudinal zone of the habitat).
Major Findings:
-Mortality by predators is greater in the later developmental stages.
-Parasitoids kill more than predators or pathogens.
-Fewer endophytes are killed by pathogens and predators than exophytes.
-Within endophytes: leaf miners had the greatest mortality by parasitoids. Galler/borers/root feeders have the lowest mortality by parasitoids.
-Mortality caused by enemies is similar in natural and cultiviated habitats.
-Exotic and native insects do not suffer different enemy induced mortality rates.
- Tropical/subtropical habitats suffer more predation and pathogens.
-Temperate habitats suffer more from parasitism.
Some issues discussed in class:
-Medians were used as a measure central tendency because the data were not distributed normally.
-The authors cited themselves often, probably to justify why they published two papers.
-For Bonferroni analysis, the accepted p values was very small. The reason for this is because it was a meta-analysis and many studies can accumulate a lot of error.
Gurevitch et al 2000... or... The Sequel: Bigger, Better, and More Amazing?
"Ecologists working with a range of organisms and environments have carried out manipulative field experiments that enable us to ask questions about the interaction between competition and predation (including herbivory) and about the relative strength of competition and predation in the field. Evaluated together, such a collection of studies can offer insight into the importance and function of these factors in nature."
Thus are the opening lines of the abstract of Jessica Gurevitch, Janet A. Morrison, and Larry V. Hedges' April 2000 Paper in The American Naturalist (Vol 155 No 4 pp 435-453). These two sentences seem to state some simple realities about the science of ecology, and ways to look at and think about data collected to come to a few simple (if not somewhat broadly overgeneralized) understandings of the interactions between organisms and between populations. A seemingly easy enough premise to make some sense out of, yes?
No. Nineteen pages later, I'm not sure my understandings of the importance of competition and predation are any more refined or concrete.
I want to respect the integrity of any paper published in a journal like The American Naturalist, but I find it quite easy to get a bit cynical about the meta analysis work of Dr Gurevitch and her collaborators (a feeling shared by at least a few other individuals in this class). The abstract of this paper goes on to say that a "new factorial meta analysis technique" will be employed to address the interactions between predation and competition, but many of the stumbling blocks encountered in Gurevitch's 1992 paper in the same journal, this time co authored by L. Morrow, A. Wallace, and J. Walsh, are encountered in this 2000 paper.
In analyzing the studies of other scientists, the playing field must be leveled so as to compare apples to apples and oranges to oranges. Published summaries of studies may not have included all of the parameters needed by Gurevitch et al to normalize the data for their studies, and we all know that with the fear of arm chair ecologists stealing our lives' works, raw data can be hard to come by. Gurevitch et al are only able to find 20 useable articles on 39 field experiments, a considerably smaller sample size than the 1992 paper, which points out the differences in meta analysis results when looking at different trophic levels and different communities (marine, freshwater, terrestrial, etc). The smaller sample size in the 2000 paper makes conclusions reached and arguments made that much less convincing.
While the sample size and breadth is an issue, some of my problems with the paper are even more basic in their nature. Competition and predation. When we think of one something murdering and eating one something else, the difference would seem obvious. On a population level, however, both are interactions between organisms where one is negatively effected by the other. Interactions where one organism or group just lowers the fitness of another can be quite the sticky wicket to parse out; herbivory and allelopathy in plants would seem to be two of many particularly slippery slopes in these respects. We have toyed with the idea in class that competition might be thought of as mostly between trophic levels, while competition is within a trophic level, but where on that spectrum would cannibalism lie? My point here is that in order to address a question of competition versus predation, one must first define these two classes to a tee. In my humble opinion, Dr Gurevitch and her collaborators do not succeed at this task.
Mention of equilibrium and non equilibrium theories and states of communities and their structuring are also referenced multiple times, but concise definitions of these terms are also lacking. Are all ecological processes not in a constant state of change on some level? At what point do Gurevitch et al define a community or even a species pair as being at equilibrium?
All of this nitpicking over words aside, does the paper come to any amazing conclusions or revelations? The opening line of the Discussion section states "The patterns that emerge from this factorial meta-analysis are strikingly clear, make sense, and are relevant to larger issues of community structure." Bold statement; but less than three paragraphs later, there is a line that is colored a bit differently in my opinion. "Our meta-analysis cannot address these types of questions, but it shows how consistently important predation can be as a factor that diminishes competitive interactions in the field." I hate to parse things a la Fox News to get at my point, but words like "can be", "a factor" (of many?) and "diminishes" are quite relative and wishy washy for something that is "strikingly clear". The ambiguity continues two pages later when Gurevitch et al states "At a very basic level, our conclusions agreed with some of those of Sih et al (1985); they reported that competition and predation were both generally important in field experiments." Independent of the need for an adverb like "generally", it is quite confusing to say in one's discussion that a pair of factors were both important when one of the main points of the paper was to parse out the importance of each factor.
Are Jessica Gurevitch, Janet A. Morrison, and Larry V. Hedges amazing scientists? Undoubtedly. Does this particular paper show all of their amazingnesses in a good (comprehensible) light to a budding ecologist like myself? I unfortunately have to say perhaps not so much. Are there more convincing uses of these meta analysis techniques? Probably. Let's look them up when we find some free time... in July maybe?
Subscribe to:
Comments (Atom)